There are multiple situations where you need to know your public IP: be it that you set up your home IT server behind a NAT, be it that your legacy enterprise business solution does not work properly without this information because the original developers 20 years ago never expected to be behind a NAT.
Of course, Ansible can help here as well: there is a tiny, neat module called ipify_facts which does nothing else but retrieving your public IP:
Besides the almost thousand modules shipped with Ansible, there are many more community modules out there developed independently. A remarkable example is a set of modules to manage Oracle DBs.
The Ansible module system is a great way to improve data center automation: automation tasks do not have to be programmed “manually” in shell code, but can be simply executed by calling the appropriate module with the necessary parameters. Besides the fact that an automation user does not have to remember the shell code the modules are usually also idempotent, thus a module can be called multiple times and only changes something when it is needed.
This only works when a module for the given task exists. The list of Ansible modules is huge, but does not cover all tasks out there. For example quite some middleware products are not covered by Ansible modules (yet?). But there are also community modules out there, not part of the Ansible package, but nevertheless of high quality and developed actively.
A good example of such 3rd party modules are the Oracle DB & ASM modules developed by oravirt aka Mikael Sandström, in a community fashion. Oracle DBs are quite common in the daily enterprise IT business. And since automation is not about configuring single servers, but about integrating all parts of a business process, Oracle DBs should also be part of the automation. Here the extensive set of Ansible modules comes in handy. According to the README (shortened):
Tablespaces can be created as bigfile, autoextended
oracle_grants
Manages privileges for a user
Grants/revokes privileges
Handles roles/sys privileges properly.
The grants can be added as a string (dba,’select any dictionary’,’create any table’), or in a list (ie.g for use with with_items)
oracle_role
Manages roles in the database
oracle_parameter
Manages init parameters in the database (i.e alter system set parameter…)
Also handles underscore parameters. That will require using mode=sysdba, to be able to read the X$ tables needed to verify the existence of the parameter.
oracle_services
Manages services in an Oracle database (RAC/Single instance)
oracle_pdb
Manages pluggable databases in an Oracle container database
Creates/deletes/opens/closes the pdb
saves the state if you want it to. Default is yes
Can place the datafiles in a separate location
oracle_sql
2 modes: sql or script
Executes arbitrary sql or runs a script
oracle_asmdg
Manages ASM diskgroup state. (absent/present)
Takes a list of disks and makes sure those disks are part of the DG. If the disk is removed from the disk it will be removed from the DG.
oracle_asmvol
Manages ASM volumes. (absent/present)
oracle_ldapuser
Syncronises users/role grants from LDAP/Active Directory to the database
oracle_privs
Manages system and object level grants
Object level grant support wildcards, so now it is possible to grant access to all tables in a schema and maintain it automatically!
I have not yet had the change to test the modules, but I think they are worth a look. The amount of quality code, the existing documentation and also the ongoing development shows an active and healthy project, development important and certainly relevant modules. Please note: these modules are not part of the Ansible community, nor part of any offering from Oracle or anyone else. So use them at your own risk, they probably will eat your data. And kittens!
So, if you are dealing with Oracle DBs these modules might be worth to take a look. And I hope they will be pushed upstream soon.
Ansible has an ever growing list of modules. For a single module this raises the question: who is responsible for it? And what is the actual status? Here a new metadata field will most likely be introduced soon.
With Ansible getting more and more traction every day, more modules are popping up everywhere – most of them inside the Ansible repository, some of them outside in the community. However, with this ever growing list of modules – almost a thousand by now – questions came up what the actual state of a module is: does it have a stable interface? Is it meant as a preview, of is it already deprecated? And how maintains it in case I have an idea for a new feature or change? The Ansible community, the core developers team, is a maintainer missing, or is the committer the source behind it?
To answer these questions, a new set of metadata for modules was proposed as a part of a larger change how Ansible modules are managed in general. The proposal and the corresponding pull request were accepted, and thus in the future each module will carry multiple data:
a version string
a supported_by flag to highlight who is the maintainer
a status field showing if it is stable, a preview, deprecated or dead
Take for example this code snippet:
# Data formatted as a python dict:

ANSIBLE_METADATA = {
    'version': '1.0',
    'supported_by': 'core|community|core_curated',
    'status': ['stableinterface|preview|deprecated|removed']
}

# Data formatted as a yaml string:
ANSIBLE_METADATA = r"""
    version: "1.0"
    supported_by: "core|community|unmaintained|committer"
    status: ["stableinterface|preview|deprecated|removed"]
"""
This will help to better understand in the future who is responsible for which module, and who can be approached. Note though that while there are plans to include it with Ansible 2.3, this is not yet released so this is still subject to change. Also, keep in mind that this is a feature for the community to work together on the project – it has nothing to do with any support statement made in any contract for example with Red Hat when purchasing Ansible Tower by Red Hat.
Ansible Tower 3.1 was just released. Time to have a closer look at some of the new features like the workflow editor.
Just a few days ago, Ansible Tower 3.1 was released. Besides the usual bug fixes, refinements of the UI and similar things this Tower version comes with major new feature: a workflow editor, scale out clustering, integration with logging providers and a new job details page.
The basic idea of a workflow is to link multiple job templates coming one after the other. They may or may not share inventory, playbooks or even permissions. The links can be conditional: if job template A succeeds, job template B is automatically executed afterwards, but in case of failure, job template C will be run. And the workflows are not even limited to job templates, but can also include project or inventory updates.
This enables new applications for Tower: besides the rather simple execution of prepared job templates, now different workflows can build upon each other. Imagine the networking team which creates a playbooks with their own content, in their own Git repository and even targeting their own inventory, while the operations team also has their own repos, playbooks and inventory. With older Tower versions there would be no simple way to bring these totally separated ways together – with 3.1 this can be done even with a graphical editor.
Workflows can be created right from the job template page. As can be seen that page got an overhaul:
The button to add a new template offers a small arrow to get a menu from which a workflow can be set up.
Afterwards, the workflow needs to be defined – name, organization, etc. This is a necessary step, before the actual links can be created:
As shown in the screenshot above from this screen on the actual editor can be started. And I must admit that I was surprised of how simple but yet rather elegant the editor looks like and works. It takes hardly any time to get used to, and the result is visually appealing and easily understandable:
The above screenshot shows the major highlights: links depending on the result of the previous job template in red and green, blue links which are executed every time, a task in the workflow to update a project (indicated by the “P”), and the actual editor.
As mentioned at the beginning, there are more features in this new Tower release. The clustering feature is an explicitly interesting feature for load balancing and HA setups, though I have not tested it yet. Another possibility is the integration of logging providers right into the UI:
As shown above a logstash logging provider was configured to gather all the Tower logs. Other possible providers are splunk, and in general everything which understands REST calls.
A change I yet have to get familiar with is the new view on the jobs page, showing running or completed jobs:
The new view is much more tailored to the output of ansible-playbook, showing the time at each task. Also, a search bar has been added which can be used to search through the results rather easily. Each taks can be clicked at to get much more details about the task. However, in the old view I liked the possibility to simply click through a play and the single tasks, getting the list of hosts adjusted automatically, etc. I can already see that the change will be for the better – but I have to get used to it first
Overall the new release is pretty impressive. Especially the workflow editor will massively help bringing different teams even closer in automation (DevOps, anyone?). Also, the cluster feature will certainly help create stable, HA like setups of Tower. The UI might take some time to get used to, but that’s ok, since there will be a benefit at the end.
Ansible is a great tool to automate almost anything in IT. However, one of the core concepts of Ansible is the inventory where the to be managed nodes are listed. However, in some situations setting up a dedicated inventory is overkill.
For example there are many situation where admins just want to ssh to a machine or two to figure something out. Ansible modules can often make such SSH calls in a much more efficient way, making them unnecessary – but creating a inventory first is a waste of time for such short tasks.
In such cases it is handy to call Ansible or Ansible playbooks without an inventory. In case of plain Ansible this can be done by addressing all nodes while at the same time limiting them to an actual hostslist:
Ansible’s strenght is to work with all kinds of devices and services – in one go. To properly call a variable value from one server while working on another host the variable needs to be referenced properly.
One of the major strength about Ansible is the capability to almost seamlessly talk to different hosts, devices and services. That’s agent-less at its best!
However, to do that often variables of one host need to be referenced on another. For the sake of an example, imagine a monitoring server which needs to ssh to the managed nodes. The task is to first collect the public SSH key of the monitoring server and afterwards add it to the managed nodes.
After that, the key needs to be distributed. It makes sense to just add a second play to the same playbook. However, since the ssh key was fetched in the first play, it is not possible to just reference it as {{ monitoringsshkey }}. That would lead to an error:
fatal: [managednode.qxyz.de]: FAILED! => {"failed": true, "msg": "the field 'args' has an invalid value, which appears to include a variable that is undefined. The error was: 'monitoringsshkey' is undefined\n\nThe error appears to have been in '/home/liquidat/ansible/sshkey.yml': line 19, column 7, but may\nbe elsewhere in the file depending on the exact syntax problem.\n\nThe offending line appears to be:\n\n tasks:\n - name: Distribute SSH to nodes\n ^ here\n"}
Instead, the variable needs to be referenced properly, highlighting the actual host it is coming from:
The reason for this need is simple: in his example we had only one host targeted in the first play – but it could also easily be five hosts. In that moment, Ansible could not reliably know which variable value to pick if we do not specify the actual host.
A few days ago the Ansible package was removed from EPEL and many ask why that happened. The background is that Ansible is now provided in certain Red Hat channels.
What happened?
In the past (pre-2017-10) most people who were on RHEL or CentOS or similar RHEL based systems used to install Ansible from the EPEL repository. This way the package was updates regularly and it was ensured that it met the quite high packaging standards of the EPEL project.
However, a few days ago someone noticed that the EPEL repositories no longer contain an Ansible rpm package:
I'm running RHEL 7.3, and have installed the latest epel-release-latest-7.noarch.rpm. However, I'm unable to install ansible from this repo.
This caused some confusion and questions about the reasons behind that move.
EPEL repository policy
To better understand what happened it is important to understand EPEL’s package policy:
EPEL strives to never replace or interfere with packages shipped by Enterprise Linux.
While the idea of EPEL is to provide cool additional packages for RHEL, they will never replace anything that is shipped.
Change at Red Hat Enterprise Linux
That philosophy regularly requires that the EPEL project removes packages: each time when RHEL adds a package EPEL needs to check if they are providing it, and removes it.
The reasons behind that move is that the newest incarnation of RHEL now comes along with so called system roles – which require Ansible to execute them.
But where to get it now?
Ansible is now directly available to RHEL users as mentioned above. Also, CentOS picked up Ansible in their extras repository, and there are plenty of other ways available.
The only case where something actually changes for people is when the EPEL repository is activated – but the extras repository is not.
Ansible has a lot of ways to manipulate variables and their content. We shed some light on the different possibilities – and how to combine them.
Ansible inbuilt filters
One way to manipulate variables in Ansible is to use filters. Filters are connected to variables via pipes, |, and the result is the modified variable. Ansible offers a set of inbuilt filters. For example the ipaddr filter can be used to find IP addresses with certain properties in a list of given strings:
# Example list of values
test_list = ['192.24.2.1', 'host.fqdn', '::1', '192.168.32.0/24', 'fe80::100/10', True, '', '42540766412265424405338506004571095040/64']

# {{ test_list | ipaddr }}
['192.24.2.1', '::1', '192.168.32.0/24', 'fe80::100/10', '2001:db8:32c:faad::/64']
Jinja2 filters
Another set of filters which can be utilized in Ansible are the Jinja2 filters of the template engine Jinja2, which is the default templating engine in Ansible.
For example the map filter can be used to pick certain values from a given dictionary. Note the following code snippet where from a list of names only the first names are given out as a list due to the mapping filter (and the list filter for the output).
vars:
  names:
    - first: Foo
      last: Bar
    - first: John
      last: Doe

 tasks:
 - debug:
     msg: "{{ names | map(attribute='first') |list }}"
Python methods
Besides filters, variables can also be modified by the Python string methods: Python is the scripting language Ansible is written in, and and provides string manipulation methods Ansible can just use. In contrast to filters, methods are not attached to variables with a pipe, but with dot notation:
Due to the close relation between Python and Jinja2 many of the above mentioned Jinja2 filters are quite similar to the string methods in Python and as a result, some capabilities like capitalize are available as a filter as well as a method:
Due to the different ways of invoking filters and methods, it is sometimes difficult to bring both together. Caution needs to be applied if filters and methods are to be mixed.
For example, if a list of IP addresses is given and we want the last element of the included address of the range 10.0.0.0/8, we first can use the ipaddr filter to only output the IP within the appropriate range, and afterwards use the split method to break up the address in a list with four elements:
vars:
 - myaddresses: ['192.24.2.1', '10.0.3.5', '171.17.32.1']

tasks:
- name: get last element of 10* IP
  debug:
    msg: "{{ (myaddresses|ipaddr('10.0.0.0/8'))[0].split('.')[-1] }}"

...

TASK [get last element of 10* IP] **************************************************************
ok: [localhost] => {
 "msg": "5"
}
As can be seen above, to attach a method to a filtered object, another set of brackets – ( ) – is needed. Also, since the result of this filter is a list, we need to take the list element – in this case this is easy since we only have one result, so we take the element 0. Afterwards, the split method is called upon the result, gives back a list of elements, and we take the last element (-1, but element 3 would have worked here as well).
Conclusion
There are many ways in Ansible to manipulate strings, however since they are coming from various sources it is sometimes a little bit tricky to find what is actually needed.
With the release of Ansible 2.4, Ansible requires that managed nodes have a Python version of at least 2.6. Most notable, this leaves RHEL 5 users wondering how to manage RHEL 5 systems in the future – given it only provides Python 2.4.
Python 3 is becoming the default Python version on more and more distributions. Fedora 28 ships Python 3, and RHEL 8 is expected to ship Python 3 as well.
With Ansible this can lead to trouble: some of these distributions do not ship a default /usr/bin/python but instead insist on picking either /usr/bin/python2 or /usr/bin/python3 thus leading to errors when Ansible is called to manage such machines:
TASK [Gathering Facts]
fatal: [116.116.116.202]: FAILED! => {"changed": false, "module_stderr": "Connection to 116.116.116.202 closed.\r\n", "module_stdout": "/bin/sh: /usr/bin/python: No such file or directory\r\n", "msg": "MODULE FAILURE\nSee stdout/stderr for the exact error", "rc": 127}
The fix is to define the Python interpreter in additional variables. They can even be provided on the command line:
Ansible Galaxy recently got a fresh update and now has much more features worth a look. Among those are automatic quality scorings.
In a recent role upload my scoring was only 4.5. One of the problems was a “invalid platform”. I wondered which platforms are supported, and how the strings for those are, but the documentation is sparse in this regard.
However, Ansible Galaxy does feature an API to query those things. And in fact galaxy.ansible.com/api/v1/platforms/ shows the appropriate Fedora versions:
Ansible uses the Jinja2 template engine to handle variables. This includes the default filter, which sets a default value if a referenced variable is not explicitly defined somewhere else.
With Ansible it might happen that instead of a skalar variable a key-value is needed, a dictionary. If you just paste the plain text in there, you might run into trouble:
fatal: [test.example.com]: FAILED! => {"changed": false, "msg": "argument env is of type and we were unable to convert to dict: dictionary requested, could not parse JSON or key=value"}
The key-value pair needs to be properly formatted:
Recently I was experimenting with Tower’s isolated nodes feature – but somehow it did not work in my environment. Debugging told me a lot about Ansible Tower – and also why you should not trust arbitrary cloud images.
Background – Isolated Nodes
Ansible Tower has a nice feature called “isolated nodes”. Those are dedicated Tower instances which can manage nodes in separated environments – basically an Ansible Tower Proxy.
An Isolated Node is an Ansible Tower node that contains a small piece of software for running playbooks locally to manage a set of infrastructure. It can be deployed behind a firewall/VPC or in a remote datacenter, with only SSH access available. When a job is run that targets things managed by the isolated node, the job and its environment will be pushed to the isolated node over SSH, where it will run as normal.
Isolated nodes are especially handy when you setup your automation in security sensitive environments. Think of DMZs here, of network separation and so on.
I was fooling around with a clustered Tower installation on RHEL 7 VMs in a cloud environment when I run into trouble though.
My problem – Isolated node unavailable
Isolated nodes – like instance groups – have a status inside Tower: if things are problematic, they are marked as unavailable. And this is what happened with my instance isonode.remote.example.com running in my lab environment:
Ansible Tower showing an instance node as unavailable
I tried to turn it “off” and “on” again with the button in the control interface. It made the node available, it was even able to executed jobs – but it became quickly unavailable soon after.
Analysis
So what happened? The Tower logs showed a Python error:
# tail -f /var/log/tower/tower.log
fatal: [isonode.remote.example.com]: FAILED! => {"changed": false,
"module_stderr": "Shared connection to isonode.remote.example.com
closed.\r\n", "module_stdout": "Traceback (most recent call last):\r\n
File \"/var/lib/awx/.ansible/tmp/ansible-tmp-1552400585.04
-60203645751230/AnsiballZ_awx_capacity.py\", line 113, in <module>\r\n
_ansiballz_main()\r\n  File \"/var/lib/awx/.ansible/tmp/ansible-tmp
-1552400585.04-60203645751230/AnsiballZ_awx_capacity.py\", line 105, in
_ansiballz_main\r\n    invoke_module(zipped_mod, temp_path,
ANSIBALLZ_PARAMS)\r\n  File \"/var/lib/awx/.ansible/tmp/ansible-tmp
-1552400585.04-60203645751230/AnsiballZ_awx_capacity.py\", line 48, in
invoke_module\r\n    imp.load_module('__main__', mod, module, MOD_DESC)\r\n
File \"/tmp/ansible_awx_capacity_payload_6p5kHp/__main__.py\", line 74, in
<module>\r\n  File \"/tmp/ansible_awx_capacity_payload_6p5kHp/__main__.py\",
line 60, in main\r\n  File
\"/tmp/ansible_awx_capacity_payload_6p5kHp/__main__.py\", line 27, in
get_cpu_capacity\r\nAttributeError: 'module' object has no attribute
'cpu_count'\r\n", "msg": "MODULE FAILURE\nSee stdout/stderr for the exact
error", "rc": 1}

PLAY RECAP *********************************************************************
isonode.remote.example.com : ok=0    changed=0    unreachable=0    failed=1
Apparently a Python function was missing. If we check the code we see that indeed in line 27 of file awx_capacity.py the function psutil.cpu_count() is called:
def get_cpu_capacity():
    env_forkcpu = os.getenv('SYSTEM_TASK_FORKS_CPU', None)
    cpu = psutil.cpu_count()
To be really sure and also to ensure that there was no weird function backporting, I checked the function call directly on the Tower machine:
# python
Python 2.7.5 (default, Sep 12 2018, 05:31:16)
[GCC 4.8.5 20150623 (Red Hat 4.8.5-36)] on linux2
Type "help", "copyright", "credits" or "license" for more information.
>>> import inspect
>>> import psutil as module
>>> functions = inspect.getmembers(module, inspect.isfunction)
>>> functions
[('_assert_pid_not_reused', <function _assert_pid_not_reused at
0x7f9eb10a8d70>), ('_deprecated', <function deprecated at 0x7f9eb38ec320>),
('_wraps', <function wraps at 0x7f9eb414f848>), ('avail_phymem', <function
avail_phymem at 0x7f9eb0c32ed8>), ('avail_virtmem', <function avail_virtmem at
0x7f9eb0c36398>), ('cached_phymem', <function cached_phymem at
0x7f9eb10a86e0>), ('cpu_percent', <function cpu_percent at 0x7f9eb0c32320>),
('cpu_times', <function cpu_times at 0x7f9eb0c322a8>), ('cpu_times_percent',
<function cpu_times_percent at 0x7f9eb0c326e0>), ('disk_io_counters',
<function disk_io_counters at 0x7f9eb0c32938>), ('disk_partitions', <function
disk_partitions at 0x7f9eb0c328c0>), ('disk_usage', <function disk_usage at
0x7f9eb0c32848>), ('get_boot_time', <function get_boot_time at
0x7f9eb0c32a28>), ('get_pid_list', <function get_pid_list at 0x7f9eb0c4b410>),
('get_process_list', <function get_process_list at 0x7f9eb0c32c08>),
('get_users', <function get_users at 0x7f9eb0c32aa0>), ('namedtuple',
<function namedtuple at 0x7f9ebc84df50>), ('net_io_counters', <function
net_io_counters at 0x7f9eb0c329b0>), ('network_io_counters', <function
network_io_counters at 0x7f9eb0c36500>), ('phymem_buffers', <function
phymem_buffers at 0x7f9eb10a8848>), ('phymem_usage', <function phymem_usage at
0x7f9eb0c32cf8>), ('pid_exists', <function pid_exists at 0x7f9eb0c32140>),
('process_iter', <function process_iter at 0x7f9eb0c321b8>), ('swap_memory',
<function swap_memory at 0x7f9eb0c327d0>), ('test', <function test at
0x7f9eb0c32b18>), ('total_virtmem', <function total_virtmem at
0x7f9eb0c361b8>), ('used_phymem', <function used_phymem at 0x7f9eb0c36050>),
('used_virtmem', <function used_virtmem at 0x7f9eb0c362a8>), ('virtmem_usage',
<function virtmem_usage at 0x7f9eb0c32de8>), ('virtual_memory', <function
virtual_memory at 0x7f9eb0c32758>), ('wait_procs', <function wait_procs at
0x7f9eb0c32230>)]
Searching for a package origin
So how to solve this issue? My first idea was to get this working by updating the entire code part to the multiprocessor lib:
# python
Python 2.7.5 (default, Sep 12 2018, 05:31:16)
[GCC 4.8.5 20150623 (Red Hat 4.8.5-36)] on linux2
Type "help", "copyright", "credits" or "license" for more information.
>>> import multiprocessing
>>> cpu = multiprocessing.cpu_count()
>>> cpu
4
But while I was filling a bug report I wondered why RHEL shipped such an ancient library. After all, RHEL 7 was released in June 2014, and psutil had cpu_count available since early 2014! And indeed, a quick search for the package via the Red Hat package search showed a weird result: python-psutil was never part of base RHEL 7! It was only shipped as part of some very, very old OpenStack channels:
access.redhat.com package search, results for python-psutil
Newer OpenStack channels in fact come along with newer versions of python-psutil.
So how did this outdated package end up on this RHEL 7 image? Why was it never updated?
The cloud image is to blame! The package was installed on it – most likely during the creation of the image: python-psutil is needed for OpenStack Heat, so I assume that these RHEL 7 images where once created via OpenStack and then used as the default image in this demo environment.
And after the initial creation of the image the Heat packages were forgotten. In the meantime the image was updated to newer RHEL versions, snapshots were created as new defaults and so on. But since the package in question was never part of the main RHEL repos, it was never changed or removed. It just stayed there. Waiting, apparently, for me
Conclusion
This issue showed me how tricky cloud images can be. Think about your own cloud images: have you really checked all all of them and verified that no package, no start up script, no configuration was changed from the Linux distribution vendor’s base setup?
With RPMs this is still manageable, you can track if packages are installed which are not present in the existing channels. But did someone install something with pip? Or any other way?
Take my case: an outdated version of a library was called instead of a much, much more recent one. If there would have been a serious security issue with the library in the meantime, I would have been exposed although my update management did not report any library to be updated.
I learned my lesson to be more critical with cloud images, checking them in more detail in the future to avoid having nasty surprises during production. And I can just recommend that you do that as well.
The tool tower-cli is often used to pre-configure Ansible Tower in a scripted way. It provides a convenient way to boot-strap a Tower configuration. But adding SSH keys as machine credentials is far from easy.
Boot-strapping Ansible Tower can become necessary for testing and QA environments where the same setup is created and destroyed multiple times. Other use cases are when multiple Tower installations need to be configured in the same way or share at least a larger part of the configuration.
One of the necessary tasks in such setups is to create machine credentials in Ansible Tower so that Ansible is able to connect properly to a target machine. In a Linux environment, this is often done via SSH keys.
However, tower-cli calls the Tower API in the background – and JSON POST data need to be in one line. But SSH keys come in multiple lines, so providing the file via a $(cat ssh_file) does not work:
But for my use case I needed to read an existing SSH file directly, and did not want to add another manual step or create an additional variables file. The trick is a rather complex piece of SED:
This method is appealing since the corresponding sed call is a little bit easier to understand. But make sure to indent the variables exactly like shown above.
Ara is a simple web server showing detailed information about Ansible runs. It is helpful in understanding and troubleshooting Ansible runs.
Background
Ansible runs, especially on the command line, do only provide limited information. Details about used variables, the timing of each task or other information are only available using additional plugins, but the details provided by them are usually narrowed to a use case.
A better way to provide information about Ansible runs is to collect the data and provide them in a web framework. That is what Ansible Tower (or AWX, the upstream project to Tower) does for example: collecting detailed data and providing them in the jobs overview.
But there are situations where a fully fledged Tower is too much, or where a comparing overview of the various runs is needed. This is where ara comes in:
ARA Records Ansible playbook runs and makes the recorded data available and intuitive for users and systems. It makes your Ansible playbooks easier to understand and troubleshoot.
ara was originally developed by people of the OpenStack community, and still today has strong ties with it. It does not replace Ansible Tower at all, since it does not manage the execution at all. It complements the information and overview part, and in a way more competes with the logging solutions which can be connected to Ansible Tower.
How to install
The installation of ara is pretty straight forward and described in the documentation: the software is basically installed via pip, afterwards the server can be started as a local running instance. The connection between Ansible and ara is done via action and callback plugins.
The installation of the ara package is quickly done. Note that on systems with both Python 2 and 3 you need to pick the right pip version:
Notice that the binaries end up in ~/.local/bin. If that is not part of the $PATH variable, the server executable to start ara needs to be addressed directly, like ~/.local/bin/ara-manage runserver:
$ ~/.local/bin/ara-manage runserver                                                                                                      * Serving Flask app "ara" (lazy loading)
 * Environment: production
   WARNING: Do not use the development server in a production environment.
   Use a production WSGI server instead.
 * Debug mode: off
2019-05-06 02:45:49,156 INFO werkzeug:  * Running on http://127.0.0.1:9191/ (Press CTRL+C to quit)
2019-05-06 02:45:55,915 INFO werkzeug: 127.0.0.1 - - [06/May/2019 02:45:55] "GET / HTTP/1.1" 302 -
The web page can be accessed by pointing a web browser towards http://127.0.0.1:9191/. Since Ansible is not connected yet to ara no data are shown:
As mentioned, to connect ara to Ansible a callback plugin is used. There are different ways available to tell Ansible to use a callback plugin, the easiest is to set up a ansible.cfg with the appropriate data:
$ python3 -m ara.setup.ansible | tee -a ansible.cfg
[defaults]
callback_plugins=/home/rwolters/.local/lib/python3.7/site-packages/ara/plugins/callbacks
action_plugins=/home/rwolters/.local/lib/python3.7/site-packages/ara/plugins/actions
Note here that this creates a new section named [defaults]. Check if your ansible.cfg already has a section called [defaults] and if so merge the entries manually. Now call a few playbooks and check the results:
ara provides easy access to all existing runs, making it possible to easily compare different runs with each other. At the same time detailed information are provided for individual runs, making it easy to figure out what actually happened.
Summary
ara is an interesting attempt at better displaying the information from Ansible runs. It helps analyzing what is happening in each run, where problems might be hidden and so on.
If you use Ansible Tower already the information are available to you anyway. If you like the way how it is presented in ara you can even use both at the same time.
Ansible and Ansible Tower provide a powerful variable system. At the same time, there are some variables reserved to one or the other, which cannot be used by others, but can be helpful. This post lists all reserved and magic variables and also important keywords.
Ansible Variables
Variables in Ansible are a powerful tool to influence and control your automation execution. In fact, I’ve dedicated a fare share of posts to the topic over the years:
The variable system is in fact so powerful that Ansible uses it itself. There are certain variables which are reserved, the so called magic variables.
The given documentation lists many of them – but is missing the Tower ones. For that reason this post list all magic variables in Ansible and Ansible Tower with references to more information.
Note that the variables and keywords might be different for different Ansible versions. The lists provided here are for Ansible 2.8 which is the current release and als shipped in Fedora – and Tower 3.4/3.5.
Reserved & Magic Variables
Magic Variables
The following list shows true magic variables. They are reserved internally and are overwritten by Ansible if needed. A “(D)” highlights that the variable is deprecated.
Facts are not magic variables because they are not internal. But they are collected during facts gathering or execution of the setup module, so it helps to keep them in mind. There are two “main” variables related to facts, and a lot of other variables depending on what the managed node has to offer. Since those are different from system to system, it is tricky to list them all. But they can be easily identified by the leading ansible_.
Tower has its own set of magic variables which are used internally to control the execution of the automation. Note that those variables can optionally start with awx_ instead of tower_.
Keywords are strictly speaking not variables. In fact, you can even set a variable named as a key word. Instead, they are the parts of a playbook that make a playbook work: think of the keys hosts, tasks, name or even the parameters of a module.
It is just important to keep those keywords in mind – and it certainly helps when you name your variables in a way that they are not mixed up with keywords by chance.
The following lists shows all keywords by where they can appear. Note that some keywords are listed multiple times because they can be used at different places.
Play
any_errors_fatal
become
become_flags
become_method
become_user
check_mode
collections
connection
debugger
diff
environment
fact_path
force_handlers
gather_facts
gather_subset
gather_timeout
handlers
hosts
ignore_errors
ignore_unreachable
max_fail_percentage
module_defaults
name
no_log
order
port
post_tasks
pre_tasks
remote_user
roles
run_once
serial
strategy
tags
tasks
vars
vars_files
vars_prompt
any_errors_fatal
become
become_flags
become_method
become_user
check_mode
collections
connection
debugger
delegate_facts
delegate_to
diff
environment
ignore_errors
ignore_unreachable
module_defaults
name
no_log
port
remote_user
run_once
tags
vars
when
Roles are an essential part of Ansible, and help in structuring your automation content. The idea is to have clearly defined roles for dedicated tasks. During your automation code, the roles will be called by the Ansible Playbooks.
Since roles usually have a well defined purpose, they make it easy to reuse your code for yourself, but also in your team. And you can even share roles with the global community. In fact, the Ansible community created Ansible Galaxy as a central place to display, search and view Ansible roles from thousands of people.
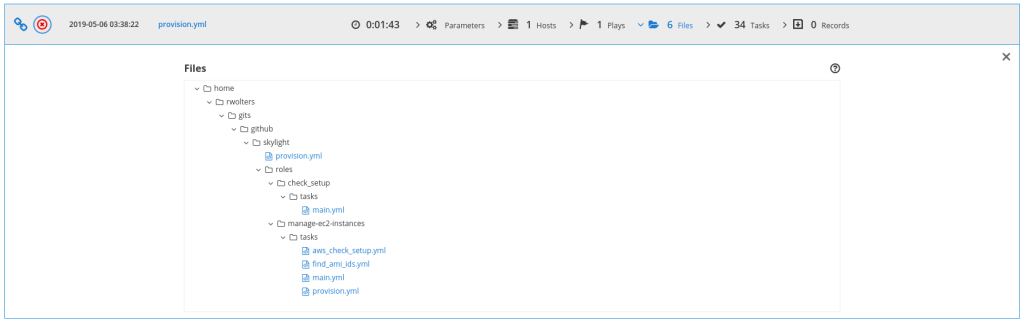
So what does a role look like? Basically it is a predefined structure of folders and files to hold your automation code. There is a folder for your templates, a folder to keep files with tasks, one for handlers, another one for your default variables, and so on:
In folders which contain Ansible code – like tasks, handlers, vars, defaults – there are main.yml files. Those contain the relevant Ansible bits. In case of the tasks directory, they often include other yaml files within the same directory. Roles even provide ways to test your automation code – in an automated fashion, of course.
This post will show how roles can be shared with others, be used in your projects and how this works with Red Hat Ansible Tower.
Share Roles via Repositories
Roles can be part of your project repository. They usually sit underneath a dedicated roles/ directory. But keeping roles in your own repository makes it hard to share them with others, to be reused and improved by them. If someone works on a different team, or on a different project, they might not have access to your repository – or they may use their own anyway. So even if you send them a copy of your role, they could add it to their own repository, making it hard to exchange improvements, bug fixes and changes across totally different repositories.
For that reason, a better way is to keep a role in its own repository. That way it can be easily shared and improved. However, to be available to a playbook, the role still needs to be included. Technically there are multiple ways to do that.
For example there can be a global roles directory outside your project where all roles are kept. This can be referenced in ansible.cfg. However, this requires that all developer setups and also the environment in which the automation is finally executed have the same global directory structure. This is not very practical.
When Git is used as the version control system, there is also the possibility of importing roles from other repositories via Git submodules, or even using Git subtrees. However, this requires quite some knowledge about advanced Git features by each and everyone using it – so it is far from simple.
The best way to make shared roles available to your playbooks is to use a function built into Ansible itself: by using the command ansible-galaxy , ansible galaxy can read a file specifying which external roles need to be imported for a successful Ansible run: requirements.yml. It lists external roles and their sources. If needed, it can also point to a specific version:
# from GitHub
- src: https://github.com/bennojoy/nginx
# from GitHub, overriding the name and specifying a tag
- src: https://github.com/bennojoy/nginx
  version: master
  name: nginx_role
# from Bitbucket
- src: git+http://bitbucket.org/willthames/git-ansible-galaxy
  version: v1.4 # from galaxy
- src: yatesr.timezone
The file can be used via the command ansible-galaxy. It reads the file and downloads all specified roles to the appropriate path:
ansible-galaxy install -r roles/requirements.yml
- extracting nginx to /home/rwolters/ansible/roles/nginx
- nginx was installed successfully
- extracting nginx_role to
/home/rwolters/ansible/roles/nginx_role
- nginx_role (master) was installed successfully
...
The output also highlights when a specific version was downloaded. You will find a copy of each role in your roles/directory – so make sure that you do not accidentally add the downloaded roles to your repository! The best option is to add them to the .gitignore file.
This way, roles can be imported into the project and are available to all playbooks while they are still shared via a central repository. Changes to the role need to be made in the dedicated repository – which ensures that no light-minded and project specific changes are done in the role.
At the same time the version attribute in requirements.ymlensures that the used role can be pinned to a certain release tag value, commit hash, or branch name. This is useful in case the development of a role is quickly moving forward, but your project has longer development cycles.
Using Roles in Ansible Tower
If you use automation on larger, enterprise scales you most likely will start using Ansible Tower sooner or later. So how do roles work with Ansible Tower? In fact – just like mentioned above. Each time Ansible Tower checks out a project it looks for a roles/requirements.yml. If such a file is present, a new version of each listed role is copied to the local checkout of the project and thus available to the relevant playbooks.
That way shared roles can easily be reused in Ansible Tower – it is built in right from the start!
Best Practices and Things to Keep in Mind
There are a few best practices around sharing of Ansible roles that make your life easier. The first is the naming and location of the roles directory. While it is possible to name the directory any way via the roles_path in ansible.cfg, we strongly recommend to stick to the directory name roles, sitting in the root of your project directory. Do not choose another name for it or move it to some subdirectory.
The same is true for requirements.yml: have one requirements.yml only, and keep it at roles/requirements.yml. While it is technically possible to have multiple files and spread them across your project, this will not work when the project is imported into Ansible Tower.
Also, if the roles are not only shared among multiple users, but are also developed with others or not by you at all, it might make sense to pin the role to the actual commit you’ve tested your setup against. That way you will avoid unwanted changes in the role behaviour.
More Information
Find, reuse, and share the best Ansible content on Ansible Galaxy.
When working with web services, especially REST APIs, Ansible can be of surprising help when you need to automate those, our want to integrate them into your automation.
However, today I run into a strange Python bug while I tried to use the uri module:
An exception occurred during task execution. To see the full traceback, use -vvv. The error was: TypeError: can't concat str to bytes
fatal: [localhost]: FAILED! => {"changed": false, "content": "", "elapsed": 0, "msg": "Status code was -1 and not [200]: An unknown error occurred: can't concat str to bytes", "redirected": false, "status": -1, "url": "https://www.ansible.com"}
This drove me almost nuts because it happened on all kinds of machines I tested, even with Ansible’s devel upstream version. It was even independent of the service I targeted – the error happened way earlier. And a playbook to showcase this was suspiciously short and simple:
---
- name: Show concat str byte error
  hosts: localhost
  connection: local
  gather_facts: no

  tasks:
    - name: call problematic URL call
      uri:
        url: "https://www.ansible.com"
        method: POST
        body_format: json
        body:
          name: "myngfw"
When I was about to fill an issue at Ansible’s Github page I thought again and wondered that this is too simple: I couldn’t imagine that I was the only one hitting this problem. I realized that the error had to be on my side. And thus meant that something was missing.
And indeed: the body_format option was not explicitly stated, so Ansible assumed “raw”, while my body data were provided in json format. A simple
Last November we introduced Ansible security automation as our answer to the lack of integration across the IT security industry. Let’s have a closer look at one of the scenarios where Ansible can facilitate typical operational challenges of security practitioners.
A big portion of security practitioners’ daily activity is dedicated to investigative tasks. Enrichment is one of those tasks, and could be both repetitive and time-consuming, making it a perfect candidate for automation. Streamlining these processes can free up their analysts to focus on more strategic tasks, accelerate the response in time-sensitive situations and reduce human errors. However, in many large organizations , the multiple security solutions aspect of these activities are not integrated with each other. Hence, different teams may be in charge of different aspects of IT security, sometimes with no processes in common.
That often leads to manual work and interaction between people of different teams which can be error-prone and above all, slow. So when something suspicious happens and further attention is needed, security teams spend a lot of valuable time operating on many different security solutions and coordinating work with other teams, instead of focusing on the suspicious activity directly.
In this blog post we have a closer look at how Ansible can help to overcome these challenges and support investigation enrichment activities. In the following example we’ll see how Ansible can be used to enable programmatic access to information like logs coming from technologies that may not be integrated into a SIEM. As an example we’ll use enterprise firewalls and intrusion detection and protection systems (IDPS).
Simple Demo Setup
To showcase the aforementioned scenario we created a simplified, very basic demo setup to showcase the interactions. This setup includes two security solutions providing information about suspicious traffic, as well as a SIEM: we use a Check Point Next Generation Firewall (NGFW) and a Snort IDPS as security solutions providing information. The SIEM to gather and analyze those data is IBM QRadar.
Also, from a machine called “attacker” we will simulate a potential attack pattern on the target machine on which the IDPS is running.
This is just a basic demo setup, a real world setup of an Ansible security automation integration would look different, and can feature other vendors and technologies.
Logs: crucial, but distributed
Now imagine you are a security analyst in an enterprise. You were just informed of an anomaly in an application, showing suspicious log activities. For example, we have a little demo where we curl a certain endpoint of the web server which we conveniently called “web_attack_simulation”:
As a security analyst you know that anomalies can be the sign of a potential threat. You have to determine if this is a false positive, that can be simply dismissed or an actual threat which requires a series of remediation activities to be stopped. Thus you need to collect more data points – like from the firewall and the IDS. Going through the logs of the firewall and IDPS manually takes a lot of time. In large organizations, the security analyst might not even have the necessary access rights and needs to contact the teams that each are responsible for both the enterprise firewall and the IDPS, asking them to manually go through the respective logs and directly check for anomalies on their own and then reply with the results. This could imply a phone call, a ticket, long explanations, necessary exports or other actions consuming valuable time.
It is common in large organisations to centralise event management on a SIEM and use it as the primary dashboard for investigations. In our demo example the SIEM is QRadar, but the steps shown here are valid for any SIEM. To properly analyze security-related events there are multiple steps necessary: the security technologies in question – here the firewall and the IDPS – need to be configured to stream their logs to the SIEM in the first place. But the SIEM also needs to be configured to help ensure that those logs are parsed in the correct way and meaningful events are generated. Doing this manually is time-intensive and requires in-depth domain knowledge. Additionally it might require privileges a security analyst does not have.
But Ansible allows security organizations to create pre-approved automation workflows in the form of playbooks. Those can even be maintained centrally and shared across different teams to enable security workflows at the press of a button.
Why don’t we add those logs to QRadar permanently? This could create alert fatigue, where too much data in the system generates too many events, and analysts might miss the crucial events. Additionally, sending all logs from all systems easily consumes a huge amount of cloud resources and network bandwidth.
So let’s write such a playbook to first configure the log sources to send their logs to the SIEM. We start the playbook with Snort and configure it to send all logs to the IP address of the SIEM instance:
Note that here we only have one task, which imports an existing role. Roles are an essential part of Ansible, and help in structuring your automation content. Roles usually encapsulate the tasks and other data necessary for a clearly defined purpose. In the case of the above shown playbook, we use the role ids_config, which manages the configuration of various IDPS. It is provided as an example by the ansible-security team. This role, like others mentioned in this blog post, are provided as a guidance to help customers that may not be accustomed to Ansible to become productive faster. They are not necessarily meant as a best practise or a reference implementation.
Using this role we only have to note a few parameters, the domain knowledge of how to configure Snort itself is hidden away. Next, we do the very same thing with the Check Point firewall. Again an existing role is re-used, log_manager:
- name: Configure Check Point to send logs to QRadar
  hosts: checkpoint

  tasks:
    - include_role:
        name: ansible_security.log_manager
        tasks_from: forward_logs_to_syslog
      vars:
        syslog_server: "192.168.3.4"
        checkpoint_server_name: "gw-2d3c54"
        firewall_provider: checkpoint
With these two snippets we are already able to reach out to two security solutions in an automated way and reconfigure them to send their logs to a central SIEM.
We can also automatically configure the SIEM to accept those logs and sort them into corresponding streams in QRadar:
- name: Add Snort log source to QRadar
  hosts: qradar
  collections:
    - ibm.qradar

  tasks:
    - name: Add snort remote logging to QRadar
      qradar_log_source_management:
        name: "Snort rsyslog source - 192.168.14.15"
        type_name: "Snort Open Source IDS"
        state: present
        description: "Snort rsyslog source"
        identifier: "ip-192-168-14-15"

- name: Add Check Point log source to QRadar
  hosts: qradar
  collections:
    - ibm.qradar

  tasks:
    - name: Add Check Point remote logging to QRadar
      qradar_log_source_management:
        name: "Check Point source - 192.168.23.24"
        type_name: "Check Point FireWall-1"
        state: present
        description: "Check Point log source"
        identifier: "192.168.23.24"
Here we do use Ansible Content Collections: the new method of distributing, maintaining and consuming automation content. Collections can contain roles, but also modules and other code necessary to enable automation of certain environments. In our case the collection for example contains a role, but also the necessary modules and connection plugins to interact with QRadar.
Without any further intervention by the security analyst, Check Point logs start to appear in the QRadar log overview. Note that so far no logs are sent from Snort to QRadar: Snort does not know yet that this traffic is noteworthy! We will come to this in a few moments.
Remember, taking the perspective of a security analyst: now we have more data at our disposal. We have a better understanding of what could be the cause of the anomaly in the application behaviour. Logs from the firewall are shown, who is sending traffic to whom. But this is still not enough data to fully qualify what is going on.
Fine-tuning the investigation
Given the data at your disposal you decide to implement a custom signature on the IDPS to get alert logs if a specific pattern is detected.
In a typical situation, implementing a new rule would require another interaction with the security operators in charge of Snort who would likely have to manually configure multiple instances. But luckily we can again use an Ansible Playbook to achieve the same goal without the need for time consuming manual steps or interactions with other team members.
There is also the option to have a set of playbooks for customer specific situations pre-create. Since the language of Ansible is YAML, even team members with little knowledge can contribute to the playbooks, making it possible to have agreed upon playbooks ready to be used by the analysts.
Again we reuse a role, ids_rule. Note that this time some understanding of Snort rules is required to make the playbook work. Still, the actual knowledge of how to manage Snort as a service across various target systems is shielded away by the role.
---
- name: Add Snort rule
  hosts: snort
  become: yes

  vars:
    ids_provider: snort

  tasks:
    - name: Add snort web attack rule
      include_role:
        name: "ansible_security.ids_rule"
      vars:
        ids_rule: 'alert tcp any any -> any any (msg:"Attempted Web Attack"; uricontent:"/web_attack_simulation"; classtype:web-application-attack; sid:99000020; priority:1; rev:1;)'
        ids_rules_file: '/etc/snort/rules/local.rules'
        ids_rule_state: present
Finish the offense
Moments after the playbook is executed, we can check in QRadar if we see alerts. And indeed, in our demo setup this is the case:
With this information on hand, we can now finally check all offenses of this type, and verify that they are all coming only from one single host – here the attacker.
From here we can move on with the investigation. For our demo we assume that the behavior is intentional, and thus close the offense as false positive.
Rollback!
Last but not least, there is one step which is often overlooked, but is crucial: rolling back all the changes! After all, as discussed earlier, sending all logs into the SIEM all the time is resource-intensive.
With Ansible the rollback is quite easy: basically the playbooks from above can be reused, they just need to be slightly altered to not create log streams, but remove them again. That way, the entire process can be fully automated and at the same time made as resource friendly as possible.
Takeaways and where to go next
It happens that the job of a CISO and her team is difficult even if they have in place all necessary tools, because the tools don’t integrate with each other. When there is a security threat, an analyst has to perform an investigation, chasing all relevant pieces of information across the entire infrastructure, consuming valuable time to understand what’s going on and ultimately perform any sort of remediation.
Ansible security automation is designed to help enable integration and interoperability of security technologies to support security analysts’ ability to investigate and remediate security incidents faster.
As next steps there are plenty of resources to follow up on the topic:
A few days ago I was asked how to best deal with structures in Ansible which are mixing dictionaries and lists. Basically, the following example was provided and the questioned remained how to deal with this – for example how to flatten it:
I was wondering a lot how to deal with this – after all dict2items only deals with dicts and fails when it reaches the lists in there. I also fooled around with the map filter, but most of my results also required some previous knowledge about the data structure, were only acting by providing “cloud1.region1” or similar.
The solution was the json_query filter: it is based on jmespath and can deal with the above mentioned structure by list and object projections:
  tasks:
  - name: Projections using json_query
    debug:
      msg: "Item value is: {{ item }}"
    loop: "{{ myhash|json_query(projection_query)|list }}"
    vars:
      projection_query: "*.*[]"
And indeed, the loop does create a simplified output of all the elements in this nested structure:
Of course, some knowledge is still needed to make this work: you need to know if you are projecting on a list or on a dictionary. So if your data structure changes on that level between executions, you might need something else.